Black Lives Matter and COVID cases RelationshipBlack Lives Matter and COVID cases Relationship
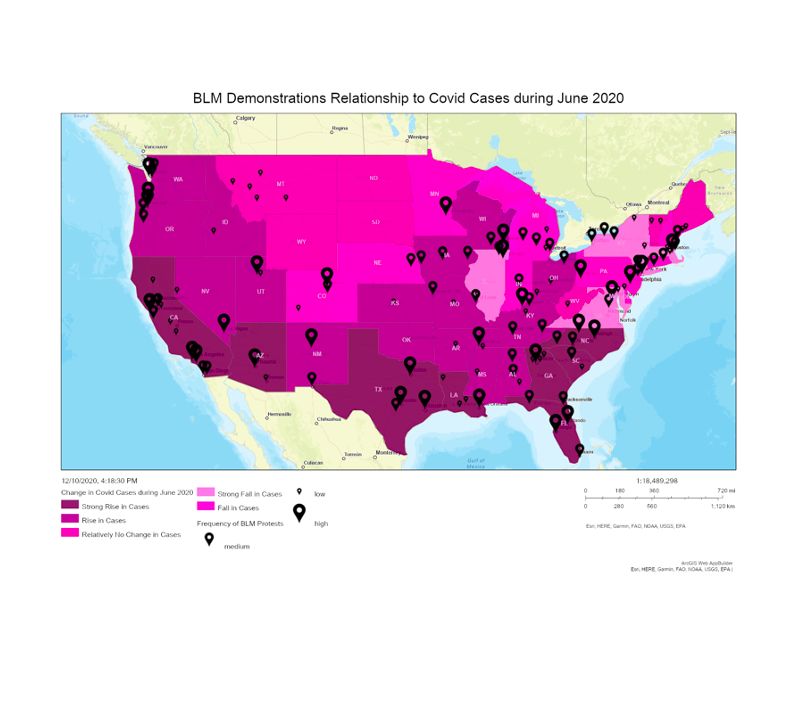
In this map, the relationship between the frequency and size of BLM protests in large cities is shown alongside the rise or fall in the rate of Covid cases during June. This month was chosen because it followed the death of George Floyd on May 25th and set a fire across the nation to people of all races to stand up and show their support for the black community and fight against police brutality. Most people were confined to their homes during quarantine but this was also a way to get out of the house and do something meaningful. This completed map illustrates how there sometimes was and other times wasn’t a correlation between a rise in Covid cases and protesting. Take for example the New York City and Washington D.C., both places had strong presence in support of BLM yet they have actually slowed the rate of Covid infection. Juxtaposed to the west coast, cities like Portland where protests occurred everynight did in fact also have rise in Covid cases but this can be tied to numerous other factors such as people traveling in from Washington, indoor activities, and mask wearing. Most protests were peaceful and people were respectful by wearing masks and staying socially distant whenever possible. During this time in history, I think it is fair to say these were the two stories consistently headlining the news.
